ABC, VED & EOQ Analysis in Hospital Inventory (With Worked Examples)
Not every item on your shelves deserves the same attention. ABC, VED and EOQ show you where to focus, what must never run out and how much to order, step by step.
In this article
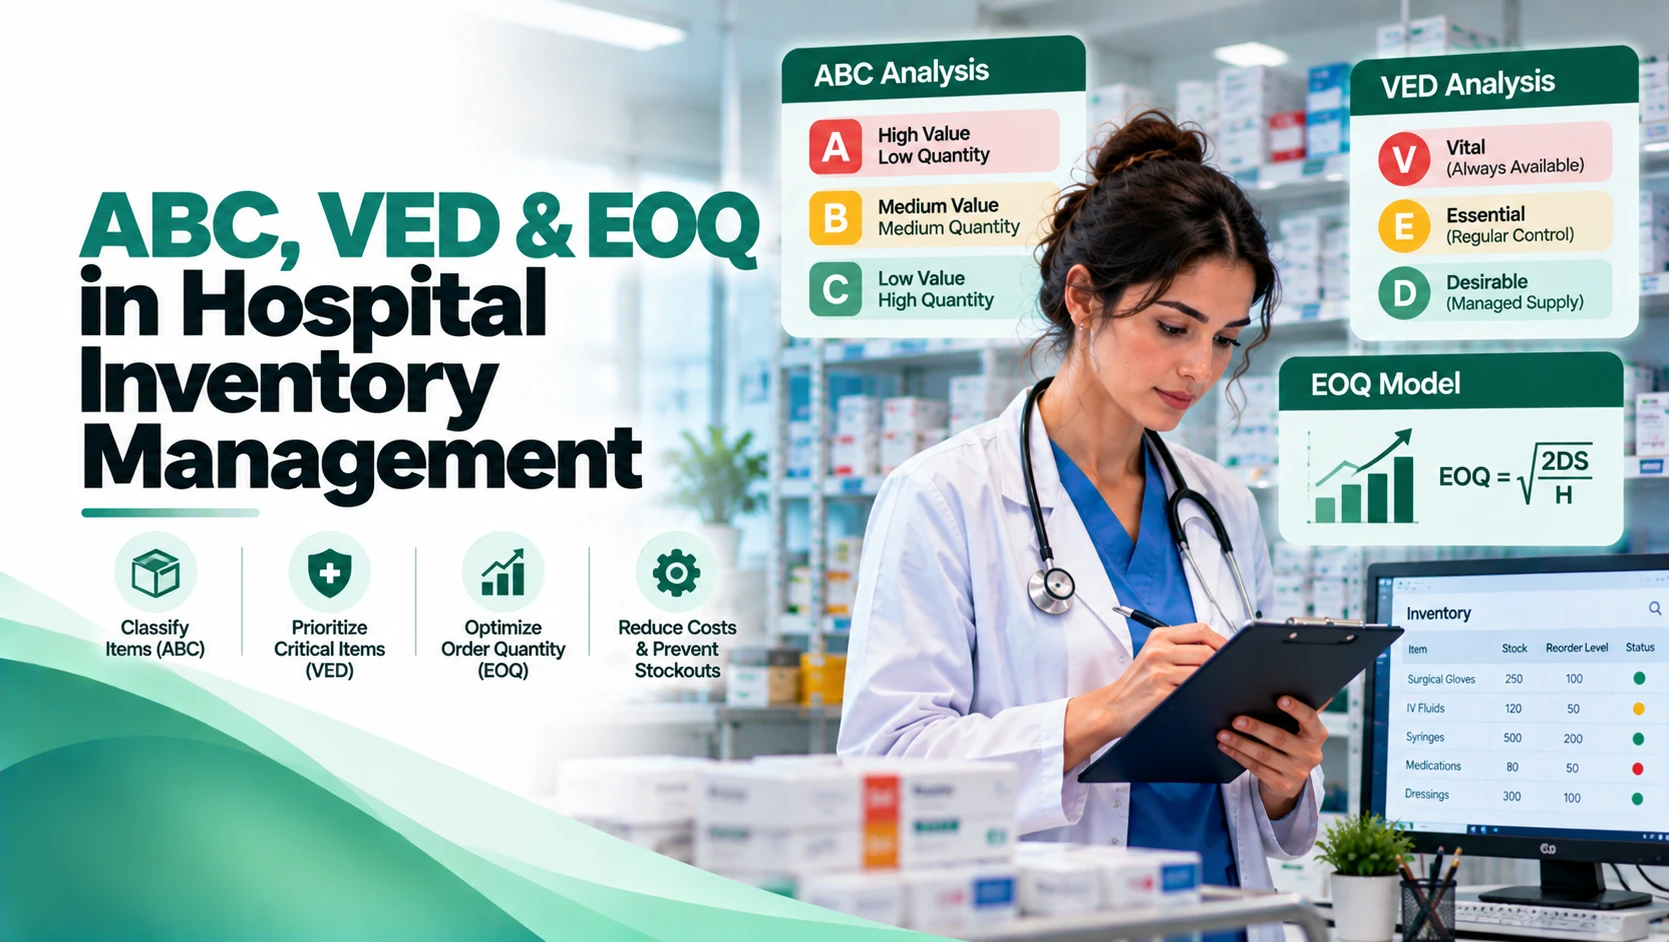
- ABC analysis ranks items by annual consumption value, so you can focus control where the money is.
- VED analysis ranks items by clinical criticality (Vital, Essential, Desirable), so you know what must never run out.
- The ABC-VED matrix combines both into three control categories (I, II, III).
- EOQ calculates the order quantity that balances ordering cost against holding cost.
- In hospitals, EOQ must be adjusted for shelf life, storage space, contracts and clinical criticality.
A typical hospital store holds thousands of items, from high-cost implants to simple gauze swabs. Managing them all the same way wastes effort on cheap items and leaves expensive or critical ones under-controlled.
Three classic tools solve this: ABC analysis, VED analysis and the economic order quantity (EOQ). Used together, they're the backbone of hospital inventory control.
What is ABC analysis?
ABC analysis classifies items by their annual consumption value (annual quantity used × unit cost). It follows the Pareto principle: a small share of items usually accounts for most of the spend.
A common convention is:
| Class | Share of annual consumption value | Typical share of items | Control level |
|---|---|---|---|
| A | about 70% | about 10–20% | Tight: frequent review, accurate forecasts, close supplier follow-up |
| B | about 20% | about 20–30% | Moderate: periodic review |
| C | about 10% | about 50–70% | Simple: larger, less frequent orders |
The exact cut-offs vary between hospitals. What matters is applying them consistently.
How to do ABC analysis step by step
- List every item with its annual quantity used and its unit cost.
- Calculate the annual consumption value for each item.
- Sort the items from highest to lowest value.
- Calculate each item's cumulative percentage of total value.
- Assign classes: up to about 70% cumulative = A, the next about 20% = B, the rest = C.
Worked example (illustrative)
Ten items with a total annual consumption value of EGP 1,000,000:
| Item | Annual value (EGP) | Cumulative % | ABC |
|---|---|---|---|
| Contrast media | 260,000 | 26% | A |
| Orthopedic implants | 200,000 | 46% | A |
| Dialysis kits | 140,000 | 60% | A |
| IV cannulas | 90,000 | 69% | A |
| Suture packs | 80,000 | 77% | B |
| Surgical gloves | 70,000 | 84% | B |
| Syringes | 60,000 | 90% | B |
| Gauze swabs | 40,000 | 94% | C |
| Alcohol swabs | 35,000 | 97.5% | C |
| Patient comfort kits | 25,000 | 100% | C |
In a short example list, A items are 40% of the lines. In a real store with thousands of items, A items are usually a much smaller share.
What is VED analysis?
ABC tells you what costs the most. It doesn't tell you what matters most to patients. A cheap item can be life-critical. VED analysis classifies items by clinical criticality:
- V – Vital: a shortage would directly endanger patients or stop essential services. These must never run out.
- E – Essential: a shortage would disrupt care significantly, but short-term workarounds exist.
- D – Desirable: a shortage causes inconvenience but no real clinical risk.
VED classification should be agreed with clinicians (for example through a pharmacy and therapeutics committee or a products committee), not decided by the store alone.
The ABC-VED matrix
Combining both gives nine groups, usually collapsed into three control categories:
| V – Vital | E – Essential | D – Desirable | |
|---|---|---|---|
| A | AV – Category I | AE – Category I | AD – Category I |
| B | BV – Category I | BE – Category II | BD – Category II |
| C | CV – Category I | CE – Category II | CD – Category III |
- Category I (AV, AE, AD, BV, CV): the tightest control. Use close monitoring, safety stock for vital items and senior attention.
- Category II (BE, BD, CE): moderate control and regular review.
- Category III (CD): simple periodic control.
Applying this to our example: dialysis kits, IV cannulas, suture packs and syringes (all vital) fall into Category I. So do contrast media and implants (A items). Gloves, gauze and alcohol swabs fall into Category II, and comfort kits into Category III.
Why the matrix matters
A cheap item such as a syringe can be "C" by value but "V" by criticality. ABC alone would under-control it. The matrix puts it in Category I, where it belongs.
What is EOQ (economic order quantity)?
Once you know which items matter, the next question is how much to order each time. Order too much and you tie up cash and risk expiry. Order too little and you pay for many small orders and risk stock-outs.
The EOQ is the order quantity that minimizes the total of ordering cost and holding cost:
EOQ = √(2 × D × S ÷ H)
D = annual demand (units) · S = cost per order · H = holding cost per unit per year
EOQ worked example
- Annual demand (D) = 12,000 units
- Cost per order (S) = EGP 300 (staff time, admin, delivery)
- Unit cost = EGP 20, with a holding cost of 20% a year, so H = EGP 4 per unit per year
EOQ = √(2 × 12,000 × 300 ÷ 4) = √1,800,000 ≈ 1,342 units per order, or about 9 orders a year.
EOQ calculator
Adjusting EOQ for hospital reality
EOQ is a starting point, not a rule. Adjust it for:
- Shelf life: never order more than you can use before expiry.
- Storage and cold-chain capacity: a refrigerator only holds so much.
- Contracts and pack sizes: suppliers may have minimum order quantities or fixed pack sizes.
- Criticality: for vital items, protect availability with safety stock even if the cost is higher.
- Demand variability: seasonal or outbreak-driven demand needs forecasting, not a fixed annual figure.
Putting it together: a simple control policy
| Category | Review frequency | Ordering approach | Safety stock |
|---|---|---|---|
| I | Weekly or continuous | EOQ adjusted for shelf life, close follow-up | Yes, especially for vital items |
| II | Monthly | EOQ or fixed reorder cycle | Moderate |
| III | Quarterly | Larger, less frequent orders | Minimal |
Next, set reorder points and par levels for each category. Our guide on how to reduce stock-outs in hospitals shows how.
Apply ABC, VED and EOQ in your hospital
Module 3 of the Healthcare Supply Chain Course covers inventory techniques (ABC, VED, EOQ), par levels and reorder points, expiry and cold chain, and warehouse best practices, in English and Arabic.
Prefer a focused, single-topic track? See our Hospital Inventory Management guide.
What is ABC VED analysis in a hospital?
It's a combined inventory classification. ABC ranks items by annual consumption value and VED ranks them by clinical criticality (Vital, Essential, Desirable). The ABC-VED matrix groups items into Categories I, II and III, so the most costly and most critical items get the tightest control.
Which items fall in Category I of the ABC-VED matrix?
AV, AE, AD, BV and CV items: every A item, plus every vital item whatever its value.
What is the EOQ formula?
EOQ = √(2DS/H), where D is annual demand, S is the cost of placing one order and H is the annual holding cost per unit.
Is EOQ suitable for medicines and medical supplies?
Yes, as a starting point. Adjust it for shelf life, storage capacity, supplier pack sizes and clinical criticality, and never order more than you can use before expiry.
How often should ABC and VED classifications be updated?
Review ABC at least once a year, or when prices or usage change significantly. Review VED with clinicians when services or formularies change.
Keep reading
 M
Written by
Medicova Editorial Team
View profile & articles
